Sunday, March 6, 2011

Map Journal Entry #10

http://www.keralahotelsandtours.com/images/kerala-maps/kerala-tourist-map.gif


          This is a tourist map of Kerala. Kerala or Keralam is a state of India which is located on the south of India’s West coast. It is a famous tourist destination for its backwaters, Ayurvedic treatments and tropical greenery that is why upon searching for a tourist map, many maps of Kerala appeared on Google image search.

          A tourist map is a type of thematic map which aims to promote tourism on a certain area. The activities that can be done on the place and the famous tourist spots are given emphasis on this type of map and the information on how to get there are also shown. Another thing that is an important information that should be on this map is the information regarding the mass transportation system like the airports and the railways since the target this map are tourists who in general, are unfamiliar with the place.

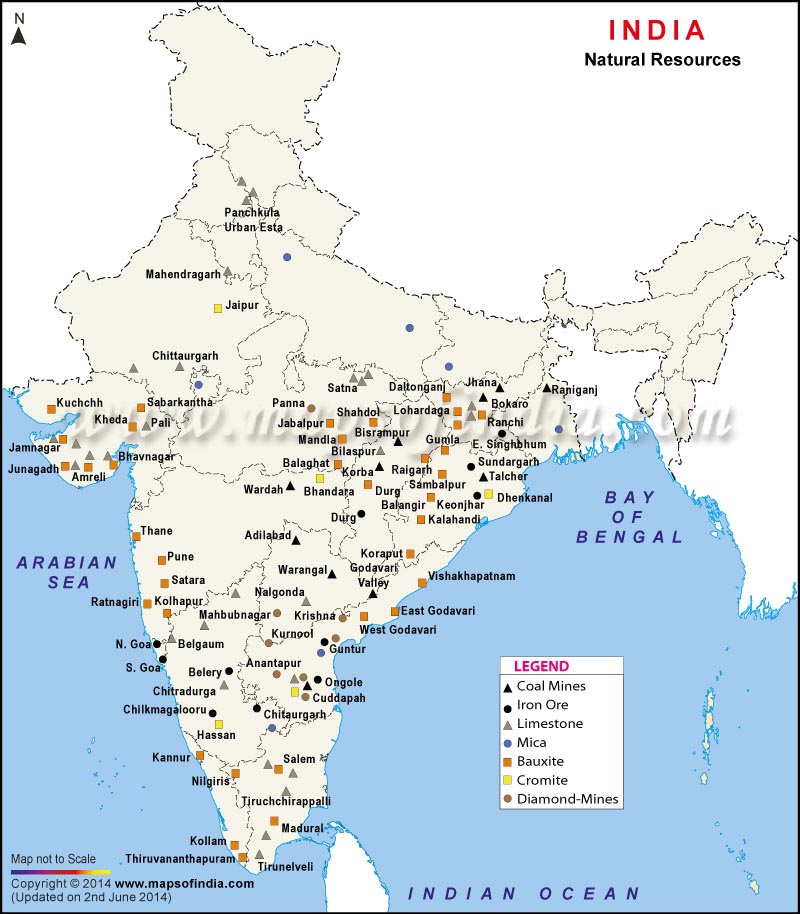
          This map, even though not to scale provided the necessary qualities to be called a tourist map. The locations of the transportation systems are included, and also, the places are labelled. The basic elements of a map, like legend and North arrow are also present.

          A flaw that I can see here is the size, to be of help to those who are unfamiliar with the place, the routes of Kerala should be seen, the main roads and the main streets. The simple question: “How to get there?” must be answered by a tourist map because its main purpose is to help tourist navigate and plan their itinerary and not just the simple information on what is where.

          So I think this map is not that good because if I were a tourist carrying this map, this would not be of much help in navigating an unfamiliar place.

Map Journal Entry #9

http://www.mapsofindia.com/images/India-Natural-Resources.jpg


          This map is also a natural resources map. It is of the same format as the one in the previous entry so I assume that this is created by the same person or the same company. This map has the elements, legend, north arrow and title but it is indicated that this map is not to scale that is why the scale bar is not present.

          Since this is a natural resource map, scale will not be that important since this will not be used entirely for navigation. Compared to the previous entry, I think this one is better because this map is consistend with the type of symbols used. It did not use the coloring of the area as a symbol but instead it used different shapes with different colors. Also, the places are labelled unlike in the previous map. This will help the readers a lot because they will know what places have abundant resources, and they won’t be needing another map to know the name of the places.

          So in conclusion, this natural resources map is way a lot better than the one in the previous entry. This will provide a better information for the map readers.

Map Journal Entry #8

http://www.brazilmapxl.com/images/natural-resources-map-of-brazil.jpg


          Natural resources map shows a vast expanse of natural resources available on and in the surface of earth. Examples of the said type of map are: natural forest cover of the world, world map of natural vegetation, map of minerals.

          This map is about the minerals, crops and livestock found in Brazil. The elements found in this map are: legend, scale, North arrow and title. One element is missing and is important for knowing the location of the area that is mapped. That element is the inset map, but I think the labelling of the surrounding countries is enough for me to know the location of the area mapped.

          As a map reader, one thing that I think is needed for the improvement of this map is the labelling of the divisions of the area mapped. That way, the information on this map that the mapmaker wants us to know is easily understood because the readers will know on which area the resources are present.

          Another thing that I can comment on is the symbols used on the legend box. The resources; coffee, cocoa, cotton, sugarcane, lumbering and reforesting, and rice have been represented as colors, the mapmaker should have also used symbols to represent this and used the colors for other purposes. For example, the mapmaker should have used the color with varying intensity to represent the abundance of the resources.

          In overall, these are just minor flaws that did not affect much the quality of the map. So I think that this map is still a good one. And also, I easily understood what the purpose of this map is although I still need to get another map of Brazil to know the divisions of the area.

Saturday, March 5, 2011

Map Journal Entry #7

http://strangemaps.files.wordpress.com/2006/12/10.jpg


          This propaganda map is also in the time of the Nazis. According to the one who recovered this map, this is created by the British between the years 1937 and 1940. The purpose of this map is to reveal what the British think of the Nazis aims. According to them, the Nazis are declaring war to grab lands from other countries.

          Again, this map is lacking in elements since it is a propaganda map. But just like other propaganda maps, there are additional contents like for example, in this map, there is a mini article on the lower right hand side which has the label “Evidences”. I think this discusses the message that this map is trying to convey, and I think that this is to support the purpose of convincing the people to the belief of the mapmaker.

Map Journal Entry #6

http://upload.wikimedia.org/wikipedia/commons/9/9a/Soviet_territory_lost_by_December_1941_Why_We_Fight_no._5.jpg


          This map is also a propaganda map. This one is created in the time of the Germany’s conquest.  This map, being a propaganda map, has missing elements since this type of map’s purpose is to convince the readers to the mapmaker’s belief, so words will be the primary ingredient in this map.

          But unlike the entry number 5 of the map journal, this map’s message is unclear.  It requires a lot of thinking on what this map is trying to say. After quite some time and some research, it has come to my mind that this map’s message is to show the dominance of the Nazis because of the idea that they already conquered the area South of Moscow. This map somehow shows the happenings during the Germany’s Operation Barbossa which is the invasion of the Soviet Union. 

Map Journal Entry #5

http://www.joelertola.com/grfx/grfx_img/ToraBora.gif


          This map is a propaganda map. This type of map is not the one used for navigation or for the dissemination of information but instead, this type of map’s purpose is to give very bias information regarding an issue. It could be true or extremely exaggerated to the point that it is not believable. One of its purposes is to somehow manipulate the thinking of the people or to convince them to the mapmaker’s belief. Map elements are not that important and are not given emphasis since it is not needed in the fulfilment of the objectives of the mapmaker.
          
          This one shows a map of an area in Afghanistan, particularly the Tora Bora Mountains. I think this is used by the United States to inform the people that they are in control on their “War on Terrorism”. This map has the basic map elements like inset, legend and north arrow although not that needed, because the only purpose of this map is to show the United States Army’s dominance over the forces of Osama Bin Laden. I also think that one of this map’s purpose is the display of power of the United States since the models of the planes are also indicated. Even the Title of the map also has the message that this map is trying to say.
     
          Therefore, in terms of serving its purpose, this map has really done its job because its message is easily understood and does not require further analysis.

Map Journal Entry #4

http://www.colocarto.com/graphics/maps/fullsize/pie_chart_map.jpg


         This map is a combination of choropleth map and a chart map. This shows the racial distribution of Southern United States through chart and the median household income through the intensity of colors. The maker of this map somehow made it very easy to understand because certain elements like legends and boundary lines are present. Also, the selection of the title of the map also made it easy to understand. I think the only thing lacking in this map is the label of the states so that mapreaders unfamiliar with the states in US will not have a hard time analysing the map. So in overall, this map has served its purpose of conveying important information in a way that map readers will easily understand it.

          But upon analysing more on the map, I also saw something negative about this map. This map somehow brings about racism because there are stereotypes that the Hispanic and the African Americans are way less productive than the whites. And also, the use of the word “black” should be replaced by African Americans because it is more politically correct.

Map Journal Entry #3

http://txsdc.utsa.edu/maps/thematic/stmap4.gif


          This map shows the net migration change in the counties of Texas in the years 1980 – 1990 and 1990 – 2000. Legend is the only present element in this map. The definitions in the legend are also not clear and are hard to understand. Mapreaders will have a hard time determining what the mapmaker is trying to point out.

          The divisions on the maps were also not clear, there should be labels on the names of the county since this map shows migration patterns. So for me, this map is not a very good thematic map because maps should be understood and also, maps are only as good as the information it passes to the people and this somehow failed to deliver the information to me well.

Map Journal Entry #2

http://geodepot.statcan.ca/Diss/Maps/ThematicMaps/population/National/pop_chg_3d_colour_e.jpg


          This thematic map shows the population change of the cities in Canada in the years 1996 to 2001. This map uses an unusual projection because the population growth determines the thickness of the area. If an area has a positive change, its thickness is increase upward and it is blue in color, downward and orange if it has a negative change, and flat if the population has no significant change. So with this projection, the thickness is well seen.

          This map has served its purpose of giving the information regarding population change and also, it has the necessary elements for the map readers to easily analyse the information the mapmaker is trying to convey. But I think he should have used a choropleth type of map, since this type of map also shows differences in intensity, by doing so, there will be lesser distortions on the map.

Map Journal Entry #1

http://www.icsm.gov.au/mapping/images/ambis.gif


          Upon searching the net, I came across a thematic map of Australia. This map shows the maritime boundaries of Australia. The map is made simple, and in fact, very simple that it doesn’t have the necessary elements that are needed for the map to be readable or understood. It has no grids and graticules which are needed for determining the coordinates and exact locations. North arrow is also not present which is needed in determining the map’s orientation. Certain elements may not be present in a map but this map shows the maritime boundaries therefore, the elements above are really needed because they are needed for determining the locations.
          So for me, this map did not really served its purpose well because a map is created to inform about certain things and this lacks information.